
Things like traffic collisions, falls, and firearm mishaps often receive widespread attention as common causes of accidental death in mainstream media, but few people are aware of just how common poisonings actually are. According to the CDC, accidental poisonings are not only increasing, but now represent the leading cause of unintentional injury deaths in the United States. Poison exposure can come from prescription medications, over-the-counter drugs, alcohol, narcotics, pesticides, household cleaners, industrial solvents, or other hazardous chemicals.
To better understand where these deaths are occurring at the highest rates, Sadaka Law analyzed mortality data from CDC Wonder to find the U.S. counties with the highest fatality rates from accidental poisoning and exposure to noxious substances. The analysis shows that West Virginia counties experience the highest fatality rates from accidental poisonings, with McDowell County ranking first nationwide at 145.66 deaths per 100,000 residents. McDowell’s fatality rate is 15.2% higher than Cabell County in West Virginia, which ranks second, and an astonishing 55.7% higher than the tenth-place fatality rate in St. Louis, Missouri.
Key Findings From the Analysis of Accidental Poisoning Deaths
The analysis focused on information from CDC Wonder’s Underlying Causes of Death dataset, which includes 10 different ICD-10 codes (X40–X49) for “Accidental poisoning by and exposure to noxious substances.” Descriptions and examples of each of these codes are provided in a later section. Several notable regional patterns emerged from our analysis of deaths from accidental poisoning and exposure to noxious substances across the United States:
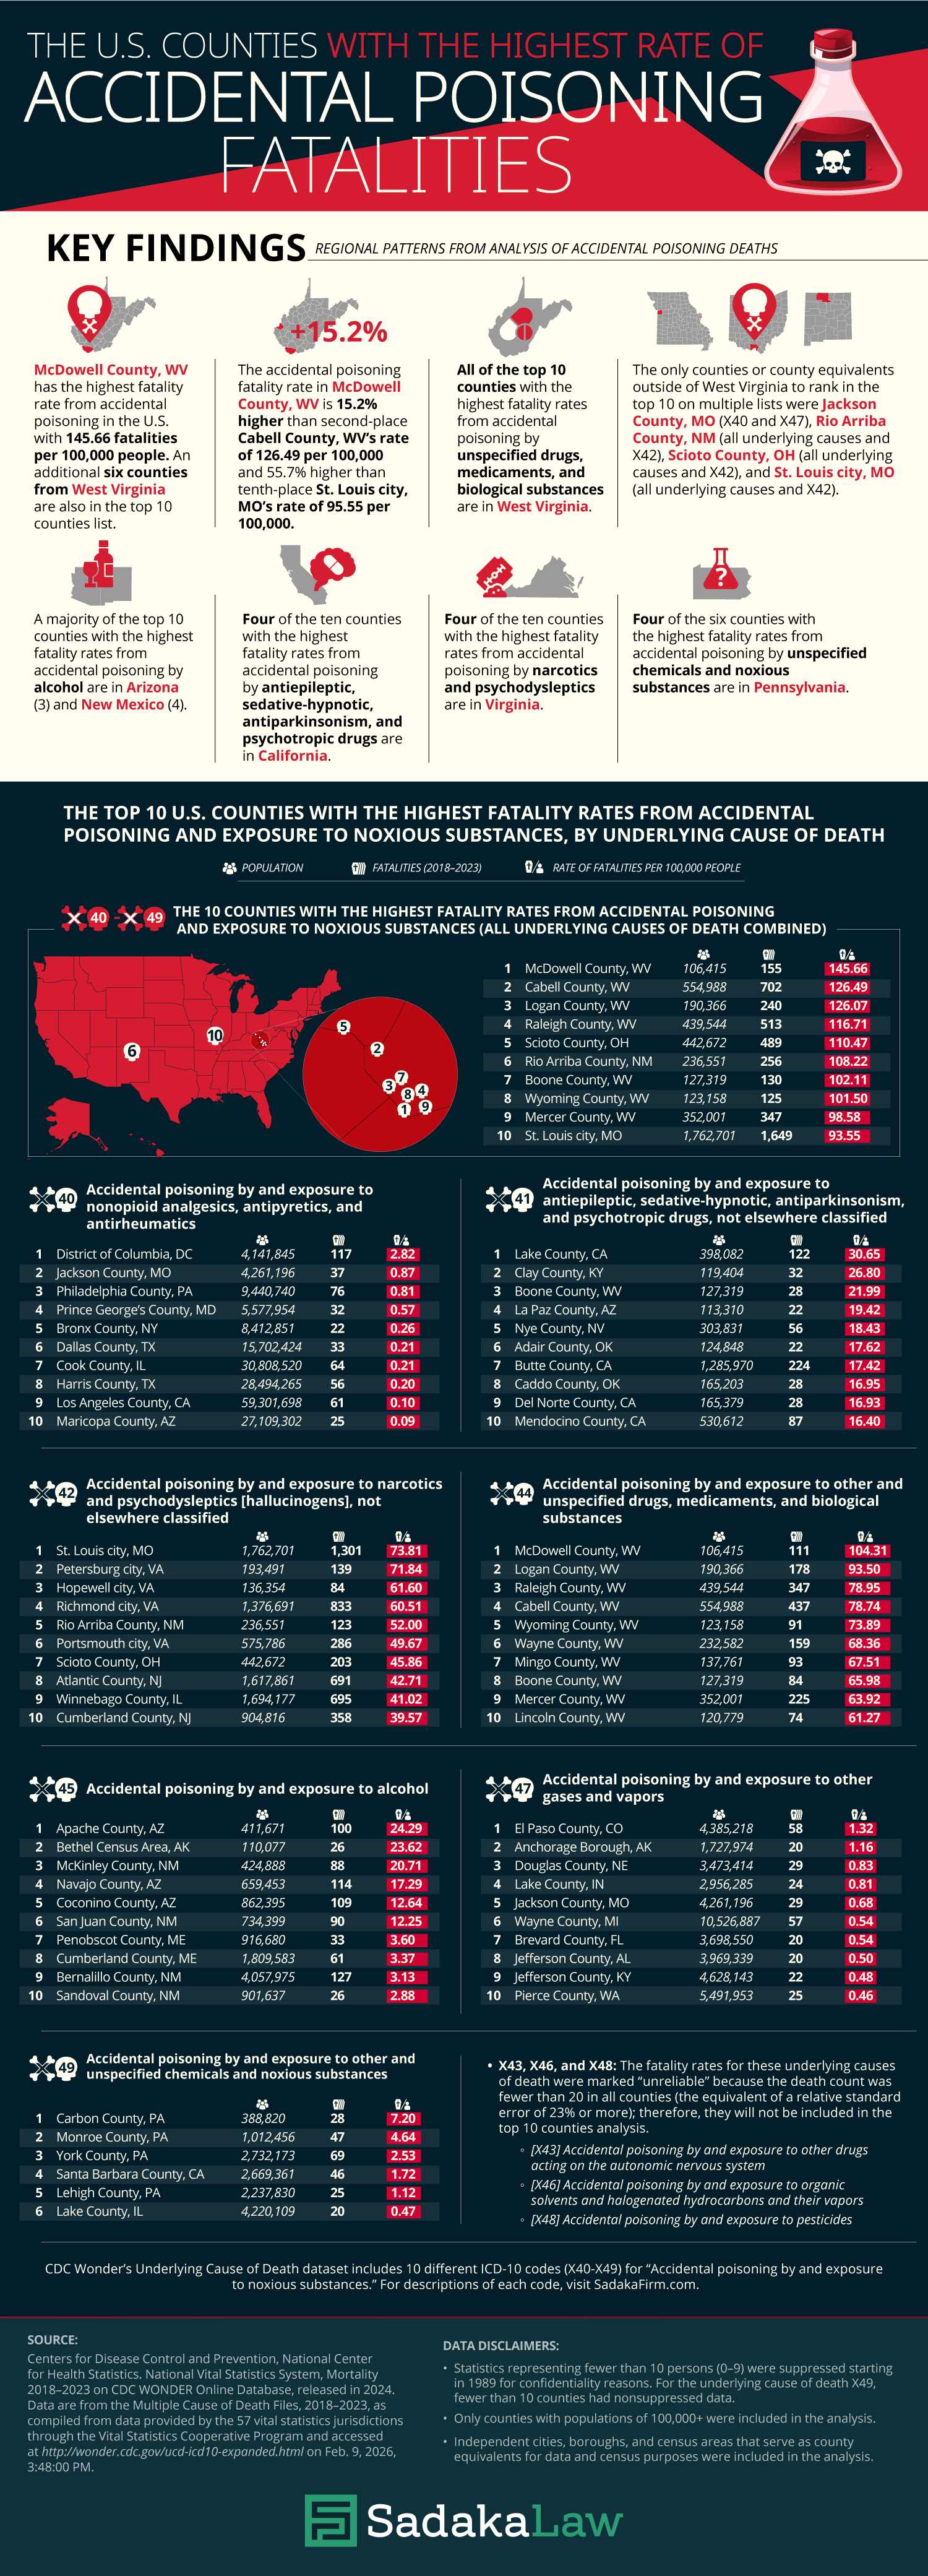
- McDowell County, West Virginia, has the highest fatality rate from accidental poisoning in the U.S., with 145.66 fatalities per 100,000 people. An additional six counties in West Virginia are also on the top-10-counties list.
- The accidental poisoning fatality rate in McDowell County, West Virginia, is 15.2% higher than second-place Cabell County, West Virginia’s rate of 126.49 per 100,000 and 55.7% higher than tenth-place St. Louis city, Missouri’s rate of 95.55 per 100,000.
- All of the top 10 counties with the highest fatality rates from accidental poisoning by unspecified drugs, medicaments, and biological substances are located in West Virginia.
- The only counties or county equivalents outside of West Virginia to rank in the top 10 on multiple lists were Jackson County, MO, Rio Arriba County, NM, and St. Louis city, MO.
- Of the ten counties with the highest fatality rates from accidental poisoning by antiepileptic, sedative-hypnotic, antiparkinsonism, and psychotropic drugs, four were in California: Lake County, Butte County, Del Norte County, and Mendocino County.
- Of the ten counties (or county equivalents) with the highest fatality rates from accidental poisoning by narcotics and psychodysleptics, four were in Virginia: Petersburg city, Hopewell city, Richmond city, and Portsmouth city.
- All of the top 10 counties with the highest fatality rates from accidental poisoning by unspecified drugs, medicaments, and biological substances were in West Virginia: McDowell County, Logan County, Raleigh County, Cabell County, Wyoming County, Wayne County, Mingo County, Boone County, Mercer County, and Lincoln County.
- Most of the top 10 counties with the highest fatality rates from accidental alcohol poisoning were in Arizona and New Mexico. The three counties in Arizona are Apache County, Navajo County, and Coconino County. The four counties in New Mexico are McKinley County, San Juan County, Bernalillo County, and Sandoval County.
- Of the six counties with available fatality rates for accidental poisoning by unspecified chemicals and noxious substances, four were in Pennsylvania: Carbon County, Monroe County, York County, and Lehigh County.
Copy and paste the HTML code below to share our infographic on your website.
<center>
<textarea readonly>
<a href="https://www.sadakafirm.com/the-us-counties-with-the-highest-rates-of-accidental-poisoning-fatalities">
<img src="https://cdn.sanity.io/images/ukhuwppw/production/7de739a1f5e4fbc46aa31bf8caea7b8cb587f18a-1500x4162.png" alt="U.S. Counties With the Highest Fatality Rates From Accidental Poisoning and Exposure to Noxious Substances - Sadaka Law Toxic Exposure Lawyers - Infographic" title="U.S. Counties With the Highest Fatality Rates From Accidental Poisoning and Exposure to Noxious Substances - SadakaLaw.com - Infographic"></a><br><a href="https://www.SadakaLaw.com" alt="Sadaka Law Toxic Exposure Lawyers" title="SadakaLaw.com">By SadakaLaw.com</a>
</textarea>
</center>
Which U.S. County Has the Highest Fatality Rate From Accidental Poisonings?
McDowell County in West Virginia has the highest overall fatality rate in the U.S. from accidental poisoning and exposure to noxious substances. Despite its smaller population, McDowell’s 155 deaths from 2018 to 2023 resulted in the highest rate in the country, at 145.66 fatalities per 100,000 people. This rate is 55.7% higher than that of the tenth-highest county.
Cabell County, also in West Virginia, has the second-highest fatality rate. It is five times larger than McDowell County, and its 702 deaths between 2018 and 2023 led to a rate of 126.49 fatalities per 100,000 people. Besides McDowell and Cabell counties, West Virginia had five other counties in the top 10 for the highest overall fatality rates from accidental poisoning and exposure to noxious substances.
The 10 Counties With the Highest Fatality Rates From Accidental Poisoning and Exposure to Noxious Substances (all underlying causes of death combined)
| Rank | County | Population | Total Fatalities (2018–2023) | Rate of fatalities per 100,000 people |
|---|---|---|---|---|
| 1 | McDowell County, WV | 106,415 | 155 | 145.66 |
| 2 | Cabell County, WV | 554,988 | 702 | 126.49 |
| 3 | Logan County, WV | 190,366 | 240 | 126.07 |
| 4 | Raleigh County, WV | 439,544 | 513 | 116.71 |
| 5 | Scioto County, OH | 442,672 | 489 | 110.47 |
| 6 | Rio Arriba County, NM | 236,551 | 256 | 108.22 |
| 7 | Boone County, WV | 127,319 | 130 | 102.11 |
| 8 | Wyoming County, WV | 123,158 | 125 | 101.50 |
| 9 | Mercer County, WV | 352,001 | 347 | 98.58 |
| 10 | St. Louis city, MO | 1,762,701 | 1,649 | 93.55 |
The Scope of Poison Exposure and Its Causes
Between 2018 and 2024, the National Poison Data System documented an average of 3,436 human exposures annually that resulted in death, with an average of 2,843 of those deaths (82.3%) deemed directly related to the exposure.
| Year | Human exposures resulting in death | Deaths deemed directly related to the exposure | Percentage of deaths directly related to the exposure |
|---|---|---|---|
| 2018 | 3,111 | 2,582 | 83.0% |
| 2019 | 2,619 | 2,048 | 78.2% |
| 2020 | 4,488 | 3,869 | 86.2% |
| 2021 | 4,497 | 3,809 | 84.7% |
| 2022 | 3,255 | 2,622 | 80.6% |
| 2023 | 3,272 | 2,700 | 82.5% |
| 2024 | 2,809 | 2,271 | 80.9% |
| Average | 3,436 | 2,843 | 82.7% |
Beyond the headline-grabbing opioid-related deaths, accidental poisonings are sometimes deceptively mundane. The substances involved are often familiar, with the most frequently reported exposures including painkillers, household cleaners, antidepressants, cardiovascular medications, and cosmetics or personal care products. Among children five and under, household cleaners and cosmetics are among the most common exposures.
The top five substance classes most frequently involved in all human poison exposures:
- Analgesics (10.5%)
- Household cleaning substances (6.94%)
- Antidepressants (5.50%)
- Cardiovascular drugs (5.12%)
- Cosmetics/personal care products (4.96%)
The top five most common poison exposures among children 5 years or younger:
- Household cleaning substances (9.96%)
- Cosmetics/personal care products (9.15%)
- Analgesics (8.85%)
- Foreign bodies/toys/miscellaneous (7.92%)
- Dietary supplements/herbals/homeopathic (6.34%)
To determine what causes accidental poisoning deaths at the highest rates, the CDC’s federal mortality data classifies fatalities under ICD-10 codes X40 through X49, each representing a different category of substance. Below are the 10 codes along with common dangerous examples of each category. The top 10 counties with the highest fatality rates from accidental poisonings caused by each poison code are also included. The analysis includes counties, independent cities, boroughs, and census areas that serve as county equivalents for data and census purposes, with a minimum population of 100,000.
The 10 Underlying Causes of Death From Poison Exposure
X40: Accidental Poisoning by and Exposure to Nonopioid Analgesics, Antipyretics, and Antirheumatics
Code X40 covers accidental poisoning by common non-opioid pain or fever medications, often resulting from taking multiple products that contain the same ingredient, dosing errors, or pediatric ingestion. Examples include Acetaminophen (Tylenol), NSAIDs like ibuprofen (Advil), and naproxen (Aleve). These over-the-counter medications can cause liver or kidney failure if used in large amounts, despite their perceived harmlessness.
The District of Columbia reports the highest rate in this category at 2.82 deaths per 100,000 people, followed by Jackson County, Missouri, and Philadelphia County, Pennsylvania.
The 10 Counties With the Highest Fatality Rates From Accidental Poisoning by Nonopioid Analgesics, Antipyretics, and Antirheumatics
| Rank | County | Population | Fatalities (2018–2023) | Rate of fatalities per 100,000 people |
|---|---|---|---|---|
| 1 | District of Columbia, DC | 4,141,845 | 117 | 2.82 |
| 2 | Jackson County, MO | 4,261,196 | 37 | 0.87 |
| 3 | Philadelphia County, PA | 9,440,740 | 76 | 0.81 |
| 4 | Prince George’s County, MD | 5,577,954 | 32 | 0.57 |
| 5 | Bronx County, NY | 8,412,851 | 22 | 0.26 |
| 6 | Dallas County, TX | 15,702,424 | 33 | 0.21 |
| 7 | Cook County, IL | 30,808,520 | 64 | 0.21 |
| 8 | Harris County, TX | 28,494,265 | 56 | 0.20 |
| 9 | Los Angeles County, CA | 59,301,698 | 61 | 0.10 |
| 10 | Maricopa County, AZ | 27,109,302 | 25 | 0.09 |
X41: Accidental Poisoning by and Exposure to Antiepileptic, Sedative-Hypnotic, Antiparkinsonism, and Psychotropic Drugs, Not Elsewhere Classified
Similarly, code X41 addresses poisoning by sedatives and medications for mental illness through dosing errors, mixing medications, or accidental ingestion. Examples include sleeping pills, sedatives, barbiturates, antidepressants, antipsychotics, and drugs used to treat Parkinson’s disease. Unfortunately, as prescriptions for anxiety and sleep disorders have increased, we’ve seen more cases where they were overused or mixed with other mild-altering substances.
Lake County, California, leads the nation with a rate of 30.65 deaths per 100,000 people, followed by Clay County, Kentucky, and Boone County, West Virginia. Kentucky and West Virginia rank first and second for the percentage of patients taking antidepressants per state. Lake County, on the other hand, is considered one of the poorest and least healthy counties in the state, based on certain metrics, which is a major risk factor for mental illness.
The 10 Counties With the Highest Fatality Rates From Accidental Poisoning by Antiepileptic, Sedative-Hypnotic, Antiparkinsonism, and Psychotropic Drugs, Not Elsewhere Classified
| Rank | County | Population | Fatalities (2018–2023) | Rate of fatalities per 100,000 people |
|---|---|---|---|---|
| 1 | Lake County, CA | 398,082 | 122 | 30.65 |
| 2 | Clay County, KY | 119,404 | 32 | 26.80 |
| 3 | Boone County, WV | 127,319 | 28 | 21.99 |
| 4 | La Paz County, AZ | 113,310 | 22 | 19.42 |
| 5 | Nye County, NV | 303,831 | 56 | 18.43 |
| 6 | Adair County, OK | 124,848 | 22 | 17.62 |
| 7 | Butte County, CA | 1,285,970 | 224 | 17.42 |
| 8 | Caddo County, OK | 165,203 | 28 | 16.95 |
| 9 | Del Norte County, CA | 165,379 | 28 | 16.93 |
| 10 | Mendocino County, CA | 530,612 | 87 | 16.40 |
X42: Accidental Poisoning by and Exposure to Narcotics and Psychodysleptics, Not Elsewhere Classified
Addressing the longstanding opioid crisis, code X42 includes unintentional overdose involving opioids or certain illicit drugs, which can cause respiratory or cardiac arrest. Examples include opioids like fentanyl, heroin, or oxycodone, and some hallucinogens or psychodysleptics.
St. Louis city, Missouri, reports a fatality rate of 73.81 per 100,000 people, one of the highest recorded; however, Virginia counties make up four of the top ten in this category. Recently, many of these deaths have been attributed to the unknown presence of fentanyl in many street drugs.
The 10 Counties With the Highest Fatality Rates From Accidental Poisoning by and Exposure to Narcotics and Psychodysleptics, Not Elsewhere Classified
| Rank | County | Population | Fatalities (2018–2023) | Rate of fatalities per 100,000 people |
|---|---|---|---|---|
| 1 | St. Louis city, MO | 1,762,701 | 1,301 | 73.81 |
| 2 | Petersburg city, VA | 193,491 | 139 | 71.84 |
| 3 | Hopewell city, VA | 136,354 | 84 | 61.60 |
| 4 | Richmond city, VA | 1,376,691 | 833 | 60.51 |
| 5 | Rio Arriba County, NM | 236,551 | 123 | 52.00 |
| 6 | Portsmouth city, VA | 575,786 | 286 | 49.67 |
| 7 | Scioto County, OH | 442,672 | 203 | 45.86 |
| 8 | Atlantic County, NJ | 1,617,861 | 691 | 42.71 |
| 9 | Winnebago County, IL | 1,694,177 | 695 | 41.02 |
| 10 | Cumberland County, NJ | 904,816 | 358 | 39.57 |
X43: Accidental Poisoning by and Exposure to Other Drugs Acting on the Autonomic Nervous System
Code X43 refers to the unintentional overdose of drugs that affect the sympathetic or parasympathetic (autonomic) nervous system through accidental ingestion, dosing errors, or mixing medications. Examples include cholinergic or anticholinergic drugs, certain glaucoma medications, and other specific ANS-acting pharmaceuticals.
The fatality rates for this underlying cause of death were marked “unreliable” because the death count was fewer than 20 in all counties (the equivalent of a relative standard error of 23% or more); therefore, it will not include a top-10-counties analysis.
X44: Accidental Poisoning by and Exposure to Other and Unspecified Drugs, Medicaments, and Biological Substances
X44 refers to an accidental poisoning or toxic reaction to a medication or biologic that does not fit a more specific drug group, or the drug is unspecified. Examples include exposure to mixed or unknown medications and unapproved or illegal drugs sold without clear ingredient disclosure.
Unfortunately, all counties in West Virginia fall into this category. McDowell County reports 104.31 deaths per 100,000 people, followed by Logan and Raleigh counties. Economic instability, limited access to treatment, and high rates of substance misuse have long been cited as causing the tragically high drug-related mortality rates in the state.
The 10 Counties With the Highest Fatality Rates From Accidental Poisoning by Other and Unspecified Drugs, Medicaments, and Biological Substances
| Rank | County | Population | Fatalities (2018–2023) | Rate of fatalities per 100,000 people |
|---|---|---|---|---|
| 1 | McDowell County, WV | 106,415 | 111 | 104.31 |
| 2 | Logan County, WV | 190,366 | 178 | 93.50 |
| 3 | Raleigh County, WV | 439,544 | 347 | 78.95 |
| 4 | Cabell County, WV | 554,988 | 437 | 78.74 |
| 5 | Wyoming County, WV | 123,158 | 91 | 73.89 |
| 6 | Wayne County, WV | 232,582 | 159 | 68.36 |
| 7 | Mingo County, WV | 137,761 | 93 | 67.51 |
| 8 | Boone County, WV | 127,319 | 84 | 65.98 |
| 9 | Mercer County, WV | 352,001 | 225 | 63.92 |
| 10 | Lincoln County, WV | 120,779 | 74 | 61.27 |
X45: Accidental Poisoning by and Exposure to Alcohol
X45 pertains to an accidental alcohol overdose, typically due to binge drinking or accidental ingestion of alcohol-containing products. Examples include alcohol such as liquor, beer or wine, as well as isopropanol (rubbing alcohol) and ethanol which can be found in products like hand sanitizer and mouthwash.
When it comes to accidental alcohol poisoning, Apache County, Arizona, ranks first at 24.29 deaths per 100,000 people. Bethel Census Area, Alaska, and McKinley County, New Mexico, also report high rates. Not only do these states rank highly for alcohol abuse, they also rank poorly for access to healthcare.
The 10 Counties With the Highest Fatality Rates From Accidental Poisoning by Alcohol
| Rank | County | Population | Fatalities (2018–2023) | Rate of fatalities per 100,000 people |
|---|---|---|---|---|
| 1 | Apache County, AZ | 411,671 | 100 | 24.29 |
| 2 | Bethel Census Area, AK | 110,077 | 26 | 23.62 |
| 3 | McKinley County, NM | 424,888 | 88 | 20.71 |
| 4 | Navajo County, AZ | 659,453 | 114 | 17.29 |
| 5 | Coconino County, AZ | 862,395 | 109 | 12.64 |
| 6 | San Juan County, NM | 734,399 | 90 | 12.25 |
| 7 | Penobscot County, ME | 916,680 | 33 | 3.60 |
| 8 | Cumberland County, ME | 1,809,583 | 61 | 3.37 |
| 9 | Bernalillo County, NM | 4,057,975 | 127 | 3.13 |
| 10 | Sandoval County, NM | 901,637 | 26 | 2.88 |
X46: Accidental Poisoning by and Exposure to Organic Solvents and Halogenated Hydrocarbons and Their Vapors
Code X46 refers to an accidental poisoning from ingesting or inhaling fumes from industrial solvents, degreasers, or refrigerants. Examples of dangerous ingredients found in these products include methylene chloride and benzene (solvents) and other volatile hydrocarbons found in cleaners, degreasers, and paint strippers.
The fatality rates for this underlying cause of death were marked “unreliable” because the death count was fewer than 20 in all counties (the equivalent of a relative standard error of 23% or more); therefore, it will not include a top-10-counties analysis.
X47: Accidental Poisoning by and Exposure to Other Gases and Vapors
X47 addresses toxic exposure through unintentional inhalation of a toxic gas or vapor in a home, vehicle, workplace, or confined space. The most common example is carbon monoxide (CO), as well as other dangerous inhalation exposures like hydrogen sulfide, chlorine gas, ammonia vapors, and toxic combustion fumes.
Carbon monoxide poisoning is a “silent killer” that causes a spike in fatalities during the winter months. This may explain why Anchorage Borough, Alaska, is one of the leaders in this category.
The 10 Counties With the Highest Fatality Rates From Accidental Poisoning by Other Gases and Vapors
| Rank | County | Population | Fatalities (2018–2023) | Rate of fatalities per 100,000 people |
|---|---|---|---|---|
| 1 | El Paso County, CO | 4,385,218 | 58 | 1.32 |
| 2 | Anchorage Borough, AK | 1,727,974 | 20 | 1.16 |
| 3 | Douglas County, NE | 3,473,414 | 29 | 0.83 |
| 4 | Lake County, IN | 2,956,285 | 24 | 0.81 |
| 5 | Jackson County, MO | 4,261,196 | 29 | 0.68 |
| 6 | Wayne County, MI | 10,526,887 | 57 | 0.54 |
| 7 | Brevard County, FL | 3,698,550 | 20 | 0.54 |
| 8 | Jefferson County, AL | 3,969,339 | 20 | 0.50 |
| 9 | Jefferson County, KY | 4,628,143 | 22 | 0.48 |
| 10 | Pierce County, WA | 5,491,953 | 25 | 0.46 |
X48: Accidental Poisoning by and Exposure to Pesticides
X48 refers to accidental toxic exposure to a pesticide product commonly used in agriculture or around the home, including insecticides, herbicides, rodenticides, and fungicides. Some of the more dangerous examples of pesticides include paraquat and aluminum phosphide.
The fatality rates for this underlying cause of death were marked “unreliable” because the death count was fewer than 20 in all counties (the equivalent of a relative standard error of 23% or more); therefore, it will not include a top-10-counties analysis.
X49: Accidental Poisoning by and Exposure to Other and Unspecified Chemicals and Noxious Substances
Finally, X49 includes unintentional toxic exposure to a chemical or noxious substance that is not classified as a pesticide, gas, vapor, or solvent. This category includes hazardous chemicals found in industrial products (strong corrosive cleaners), banned or restricted substances found in consumer goods (TPO in gel nail products), and PFAS, also known as “forever chemicals” (firefighting foams).
Statistics representing fewer than 10 persons (0–9) were suppressed starting in 1989 for confidentiality reasons. For the underlying cause of death X49, fewer than 10 counties had nonsuppressed data. Of the six counties with data, Carbon County, Pennsylvania, ranks first with 7.20 deaths per 100,000 people.
The 10 Counties With the Highest Fatality Rates From Accidental Poisoning by Other and Unspecified Chemicals and Noxious Substances
| Rank | County | Population | Fatalities (2018–2023) | Rate of fatalities per 100,000 people |
|---|---|---|---|---|
| 1 | Carbon County, PA | 388,820 | 28 | 7.20 |
| 2 | Monroe County, PA | 1,012,456 | 47 | 4.64 |
| 3 | York County, PA | 2,732,173 | 69 | 2.53 |
| 4 | Santa Barbara County, CA | 2,669,361 | 46 | 1.72 |
| 5 | Lehigh County, PA | 2,237,830 | 25 | 1.12 |
| 6 | Lake County, IL | 4,220,109 | 20 | 0.47 |
Recent Real-World Examples of Exposure to Noxious Substances
To better illustrate how people encounter these poisonous and noxious substances in daily life, we’ve included some recent real-world examples of exposures to common products that contain them.
X41: The AAAS published an article in January 2026 highlighting how it has become more common for senior patients with dementia to be prescribed antipsychotic medication, even though these drugs do little for dementia and carry a warning that they increase the risk of death in seniors. The annual rate of antipsychotic use among adults 65 and older increased nearly 52% from 2015 to 2024.
X46: As of January 2026, the FDA has found 10 cosmetic products marketed as gel nail polish removers that contain methylene chloride, a prohibited ingredient that is not permitted in cosmetics at any level. The methylene chloride concentration in these products ranged from 77.1% to 94.4%.
X47: Carbon monoxide poisoning is always a risk, especially in the colder months when people rely on alternative heating sources. Hospitals have seen an uptick in cases during the unusually frigid winter of 2025–2026. Children are at higher risk of carbon monoxide poisoning because they process the gas differently than adults.
X48: In October 2025, a new study published in Environmental Research linked prenatal pesticide exposure to the rare but deadly childhood cancer neuroblastoma. The study found that pregnant women living near areas treated with certain insecticides or fungicides had an increased risk of having babies who would develop neuroblastoma:
- Flonicamid (insecticide): 33%
- Cypermethrin (insecticide): 53%
- Permethrin (insecticide): 24%
- Benomyl (fungicide): 20%
X49: At the beginning of 2025, it was discovered that the chemical company 3M knew its firefighting foams contained toxic substances known as “forever chemicals.” The foam contained PFOS and PFOA, synthetic chemicals that can take thousands of years to degrade and have been linked to a series of health issues, including cancer. The foam was marketed as harmless and biodegradable and is now widespread worldwide.
X49: In November 2025, Greenpeace Germany released the results of its investigation, which found that the online retailer Shein continues to sell clothing containing hazardous chemicals. Of the products tested, 32% exceeded the limits set by the European Chemicals Regulation, including children’s clothing. The “forever chemical” PFAS was detected alongside plasticizers, phthalates, and other chemicals.
New Jersey Counties With the Highest Accidental Poisoning Fatality Rates
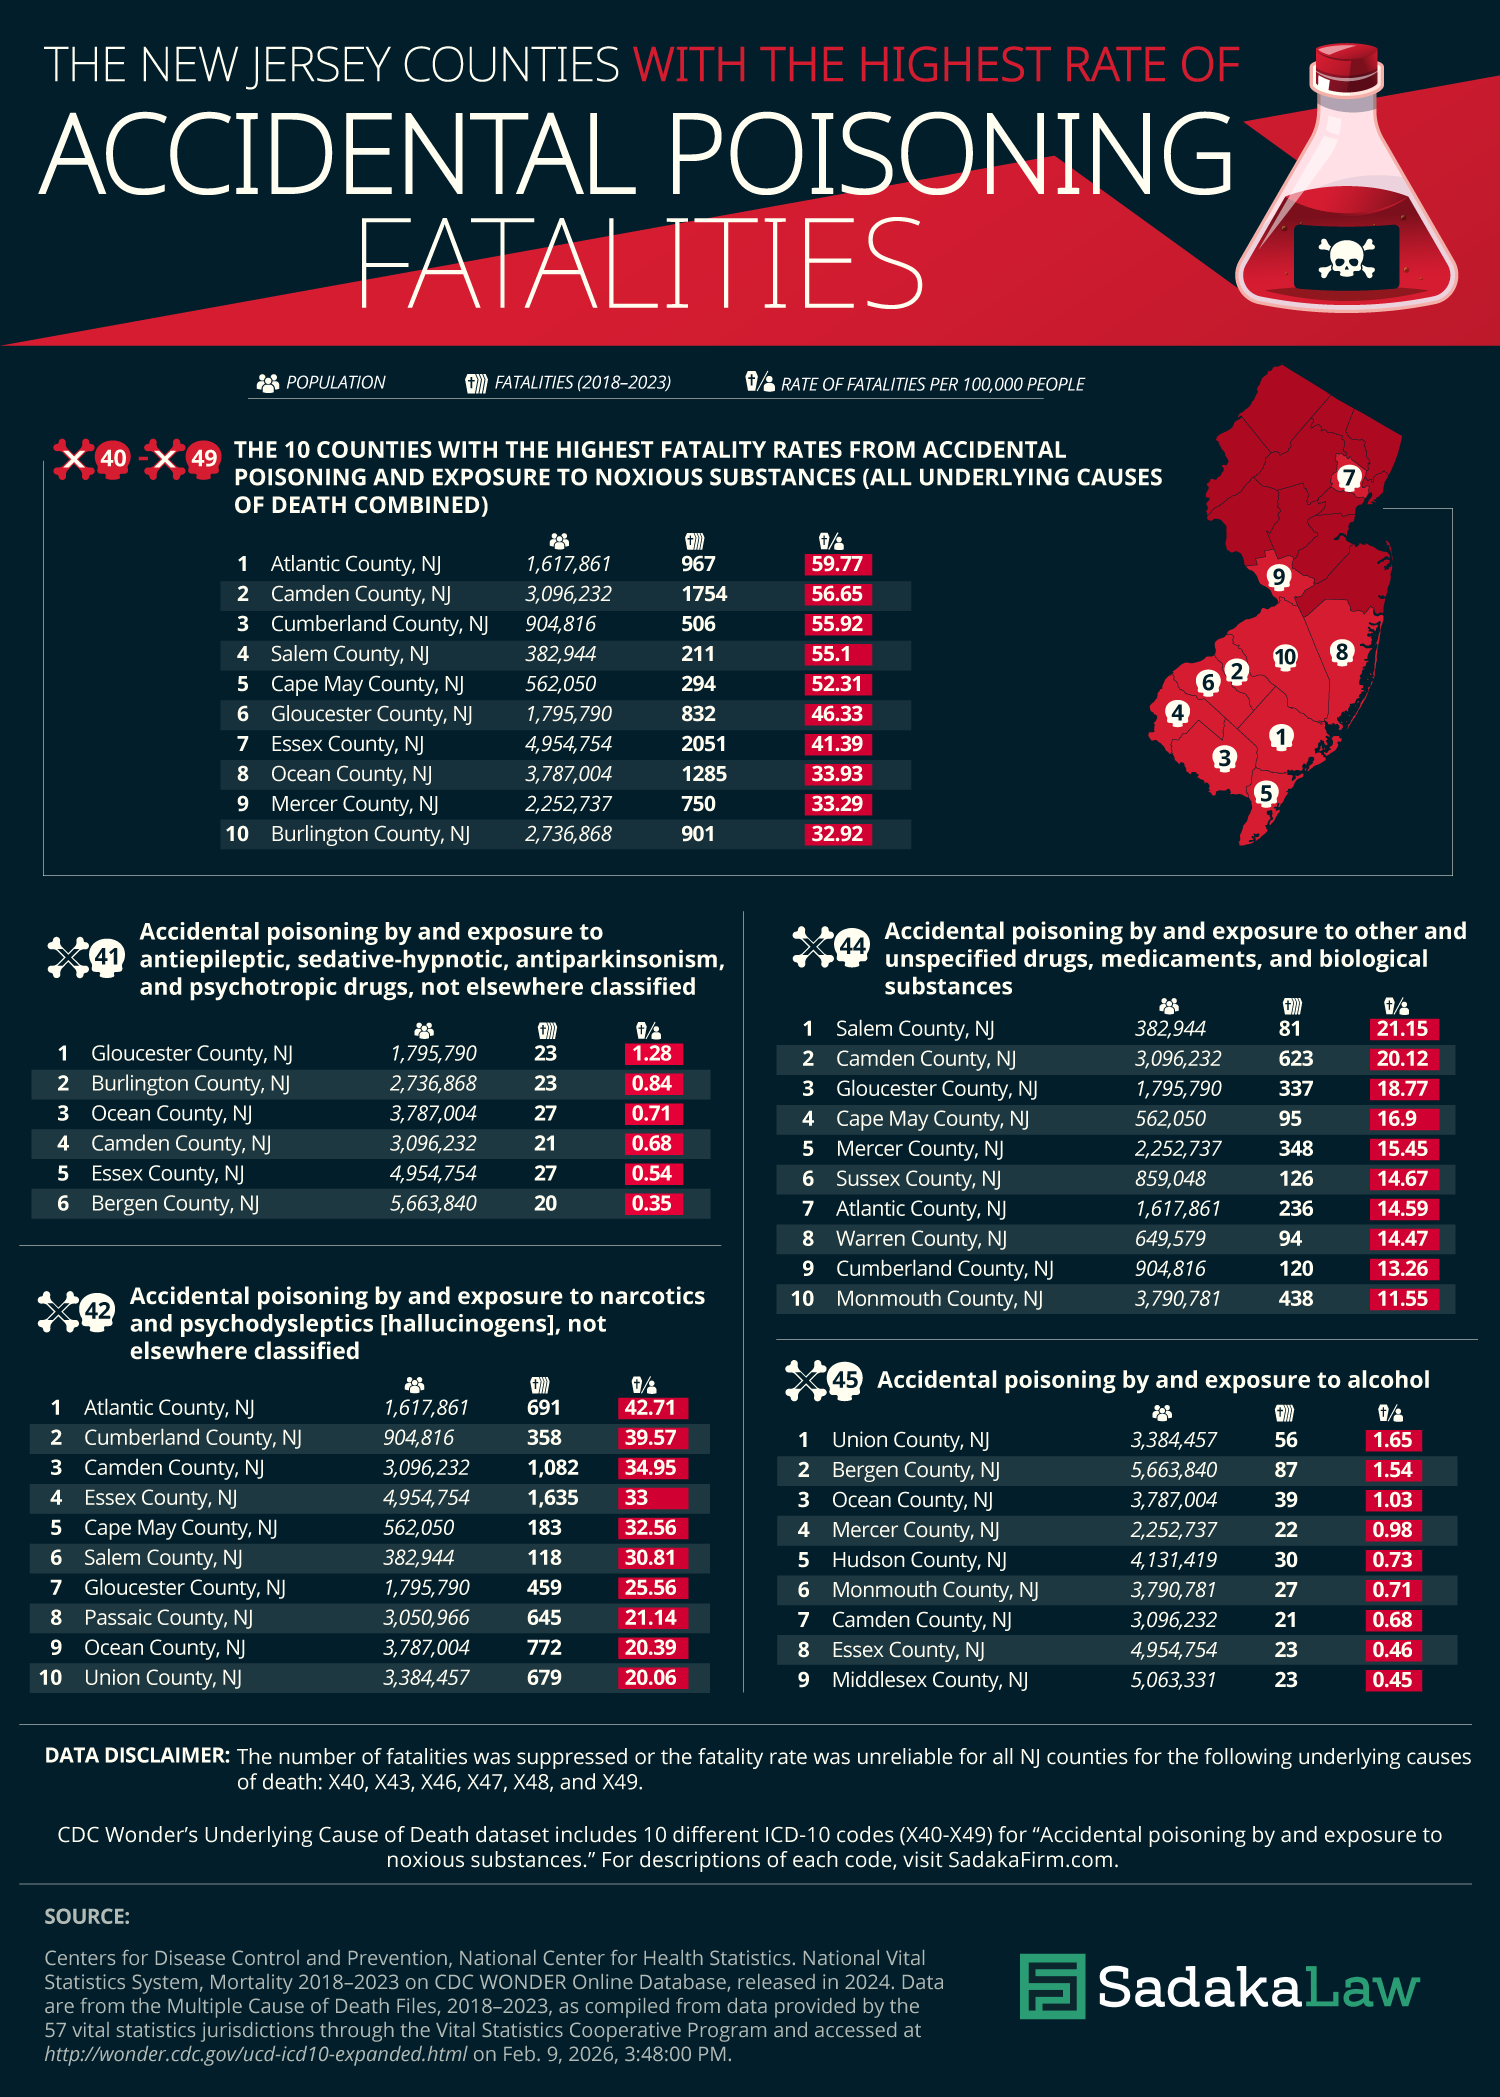
Looking closer to home, New Jersey has unfortunately not escaped the problem of accidental deaths caused by poisoning. Atlantic County was found to have the highest overall fatality rate from accidental poisoning, at 59.77 per 100,000 residents. From 2018 to 2023, the county experienced a total of 967 deaths attributed to accidental poisoning.
Copy and paste the HTML code below to share our infographic on your website.
<center>
<textarea readonly>
<a href="https://www.sadakafirm.com/the-us-counties-with-the-highest-rates-of-accidental-poisoning-fatalities/">
<img src="https://cdn.sanity.io/images/ukhuwppw/production/6e906acaecf41ab407e44fab2fe883c7634aad71-1500x2097.png" alt="New Jersey Counties With the Highest Fatality Rates From Accidental Poisoning and Exposure to Noxious Substances, by Underlying Cause of Death - Sadaka Law New Jersey Toxic Exposure Lawyers - Infographic" title="New Jersey Counties With the Highest Fatality Rates From Accidental Poisoning and Exposure to Noxious Substances, by Underlying Cause of Death - SadakaLaw.com - Infographic"></a><br><a href="https://www.SadakaLaw.com" alt="Sadaka Law New Jersey Toxic Exposure Lawyers" title="SadakaLaw.com">By SadakaLaw.com</a>
</textarea>
</center>
The 10 New Jersey Counties With the Highest Fatality Rates From Accidental Poisoning (all underlying causes of death combined)
| Rank | County | Population | Total Fatalities (2018–2023) | Rate of fatalities per 100,000 people |
|---|---|---|---|---|
| 1 | Atlantic County, NJ | 1,617,861 | 967 | 59.77 |
| 2 | Camden County, NJ | 3,096,232 | 1,754 | 56.65 |
| 3 | Cumberland County, NJ | 904,816 | 506 | 55.92 |
| 4 | Salem County, NJ | 382,944 | 211 | 55.10 |
| 5 | Cape May County, NJ | 562,050 | 294 | 52.31 |
| 6 | Gloucester County, NJ | 1,795,790 | 832 | 46.33 |
| 7 | Essex County, NJ | 4,954,754 | 2,051 | 41.39 |
| 8 | Ocean County, NJ | 3,787,004 | 1,285 | 33.93 |
| 9 | Mercer County, NJ | 2,252,737 | 750 | 33.29 |
| 10 | Burlington County, NJ | 2,736,868 | 901 | 32.92 |
New Jersey Counties With the Highest Fatality Rates From Accidental Poisoning, by Underlying Cause of Death
Which New Jersey counties ranked at the top for each of the underlying causes of death from accidental poisoning? Our analysis of New Jersey counties only includes rankings for codes X41, X42, X44, and X45, as the number of fatalities was suppressed or the fatality rate was unreliable for all New Jersey counties for the additional underlying causes of death.
The New Jersey Counties With the Highest Fatality Rates Accidental Poisoning by Antiepileptic, Sedative-hypnotic, Antiparkinsonism, and Psychotropic Drugs, Not Elsewhere Classified
Gloucester County has the highest rate of accidental poisoning deaths from sedatives and mental health medications in New Jersey. Its rate of 1.28 per 100,000 is 52.4% higher than the next highest in the state.
| Rank | County | Population | Fatalities (2018–2023) | Rate of fatalities per 100,000 people |
|---|---|---|---|---|
| 1 | Gloucester County, NJ | 1,795,790 | 23 | 1.28 |
| 2 | Burlington County, NJ | 2,736,868 | 23 | 0.84 |
| 3 | Ocean County, NJ | 3,787,004 | 27 | 0.71 |
| 4 | Camden County, NJ | 3,096,232 | 21 | 0.68 |
| 5 | Essex County, NJ | 4,954,754 | 27 | 0.54 |
| 6 | Bergen County, NJ | 5,663,840 | 20 | 0.35 |
The 10 New Jersey Counties With the Highest Fatality Rates From Accidental Poisoning by Narcotics and Psychodysleptics, Not Elsewhere Classified
Atlantic County ranks first in narcotics-related fatalities, with a rate of 42.71 per 100,000 people. This high fatality rate could be attributed to the large number of tourists visiting Atlantic City for its nightlife and casinos.
| Rank | County | Population | Fatalities (2018–2023) | Rate of fatalities per 100,000 people |
|---|---|---|---|---|
| 1 | Atlantic County, NJ | 1,617,861 | 691 | 42.71 |
| 2 | Cumberland County, NJ | 904,816 | 358 | 39.57 |
| 3 | Camden County, NJ | 3,096,232 | 1,082 | 34.95 |
| 4 | Essex County, NJ | 4,954,754 | 1,635 | 33.00 |
| 5 | Cape May County, NJ | 562,050 | 183 | 32.56 |
| 6 | Salem County, NJ | 382,944 | 118 | 30.81 |
| 7 | Gloucester County, NJ | 1,795,790 | 459 | 25.56 |
| 8 | Passaic County, NJ | 3,050,966 | 645 | 21.14 |
| 9 | Ocean County, NJ | 3,787,004 | 772 | 20.39 |
| 10 | Union County, NJ | 3,384,457 | 679 | 20.06 |
The 10 New Jersey Counties With the Highest Fatality Rates From Accidental Poisoning by Other and Unspecified Drugs, Medicaments, and Biological Substances
Salem County stands out with the highest rate of accidental poisoning fatalities in the state, at 21.15 per 100,000 people. This rural county was recently reported to have elevated levels of PFAS chemicals in groundwater near industrial sites, along with high rates of drug abuse.
Interestingly, wealthier coastal counties like Cape May (16.90 per 100,000) also appear on the list. The seasonal nature of these areas can lead to economic instability during the off-season, which can contribute to substance abuse.
| Rank | County | Population | Fatalities (2018–2023) | Rate of fatalities per 100,000 people |
|---|---|---|---|---|
| 1 | Salem County, NJ | 382,944 | 81 | 21.15 |
| 2 | Camden County, NJ | 3,096,232 | 623 | 20.12 |
| 3 | Gloucester County, NJ | 1,795,790 | 337 | 18.77 |
| 4 | Cape May County, NJ | 562,050 | 95 | 16.90 |
| 5 | Mercer County, NJ | 2,252,737 | 348 | 15.45 |
| 6 | Sussex County, NJ | 859,048 | 126 | 14.67 |
| 7 | Atlantic County, NJ | 1,617,861 | 236 | 14.59 |
| 8 | Warren County, NJ | 649,579 | 94 | 14.47 |
| 9 | Cumberland County, NJ | 904,816 | 120 | 13.26 |
| 10 | Monmouth County, NJ | 3,790,781 | 438 | 11.55 |
The 10 New Jersey Counties With the Highest Fatality Rates From Accidental Poisoning by Alcohol
In the alcohol category, Union County and Bergen County report the highest fatality rates in the state, with 1.65 and 1.54 per 100,000 people, respectively. The city of Union, located in Union County, ranked third for “booziest towns in New Jersey” with 41 consumption licenses.
| Rank | County | Population | Fatalities (2018–2023) | Rate of fatalities per 100,000 people |
|---|---|---|---|---|
| 1 | Union County, NJ | 3,384,457 | 56 | 1.65 |
| 2 | Bergen County, NJ | 5,663,840 | 87 | 1.54 |
| 3 | Ocean County, NJ | 3,787,004 | 39 | 1.03 |
| 4 | Mercer County, NJ | 2,252,737 | 22 | 0.98 |
| 5 | Hudson County, NJ | 4,131,419 | 30 | 0.73 |
| 6 | Monmouth County, NJ | 3,790,781 | 27 | 0.71 |
| 7 | Camden County, NJ | 3,096,232 | 21 | 0.68 |
| 8 | Essex County, NJ | 4,954,754 | 23 | 0.46 |
| 9 | Middlesex County, NJ | 5,063,331 | 23 | 0.45 |
Accidental poisonings in New Jersey and nationwide represent a significant and growing public health crisis. In some cases, these deaths are caused by misuse, but other times, they’re tied to exposure at workplaces, unsafe housing conditions, or faulty products. When negligence, inadequate warnings, or regulatory failures lead to a fatal poisoning, families deserve clear answers.
Methodology for Identifying U.S. Counties With the Highest Accidental Poisoning Fatality Rates
To identify U.S. counties with the highest fatality rates from accidental poisoning and exposure to noxious substances, we analyzed mortality data from the National Center for Health Statistics, available through CDC WONDER. We examined “All Ages Deaths by Underlying Cause” data from 2018 to 2023 for deaths related to accidental poisoning and exposure to noxious substances. This category encompasses 10 underlying causes, covering substances such as alcohol, pesticides, narcotics, gases and vapors, drugs, chemicals, and more.
To make fair comparisons across counties of different sizes, we calculated fatality rates per 100,000 residents. This calculation used each county’s population and its total number of deaths from accidental poisoning and exposure to noxious substances during the specified period. We then identified the 10 counties with the highest fatality rates for each of the 10 underlying causes, as well as the 10 counties with the highest overall fatality rates for accidental poisoning and exposure. To reduce distortion from very small populations, only counties with at least 100,000 residents were included in the analysis. Independent cities, boroughs, and “census areas” that serve as county equivalents for the Census Bureau and data reporting purposes were also included.
Some underlying causes of death were excluded from the top 10 county analysis due to being marked “unreliable” across all counties. This designation applies when the death count is fewer than 20 and the relative standard error is 23% or higher. Additionally, CDC WONDER suppresses statistics for counts of fewer than 10 deaths for confidentiality reasons.
If you have lost a loved one due to accidental poisoning, chemical exposure, carbon monoxide poisoning, pesticide poisoning, or contact with a hazardous product, our injury law firm is prepared to investigate the circumstances. Contact our office today for a confidential consultation and learn how we can pursue accountability on your behalf.
Source: Centers for Disease Control and Prevention, National Center for Health Statistics. National Vital Statistics System, Mortality 2018–2023 on CDC WONDER Online Database, released in 2024. Data are from the Multiple Cause of Death Files, 2018–2023, as compiled from data provided by the 57 vital statistics jurisdictions through the Vital Statistics Cooperative Program and accessed at http://wonder.cdc.gov/ucd-icd10-expanded.html on Feb. 9, 2026, 3:48:00 PM.